
 03:00
03:00Loads the original post from X.
The original recipe
From the creator589 chars
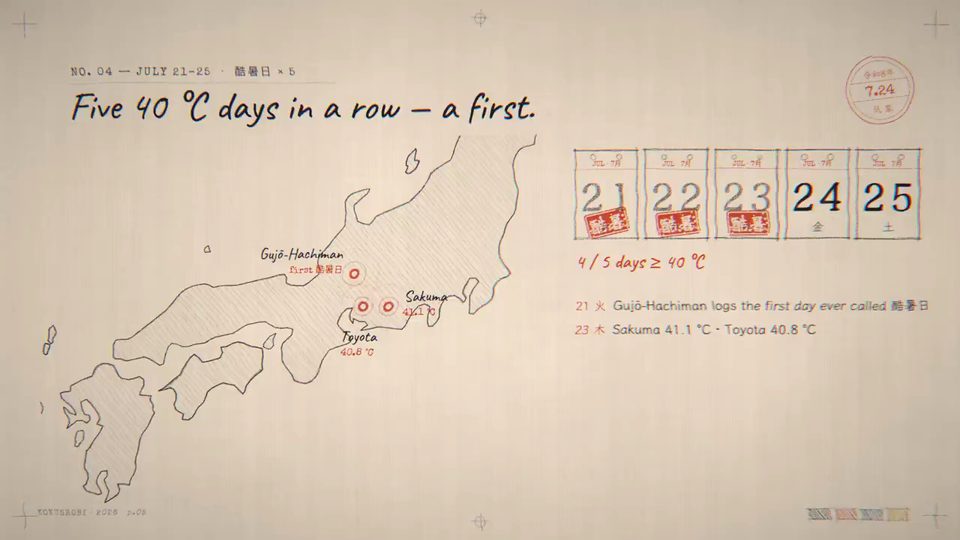
All right, this is an empty repo. Make me a 3-minute animated visualization using JavaScript, or you can do it in TypeScript if you want, about Japan's hot weather in 2026. Pull some online data to see why it was hot and how it compares to other years. I really want the animation to be visually appealing. I wanted to use a hand-drawn pencil style with a little bit of tasteful chromatic aberration. And maybe a bit of a pastiche look but it's supposed to look really, really cool. Also, use a JavaScript synthesizer to make a melody for this visualization that goes along with the theme.
Likely the creator's prompt: two or more collections agree, but it was not found in the post itself.
More like this
 02:22
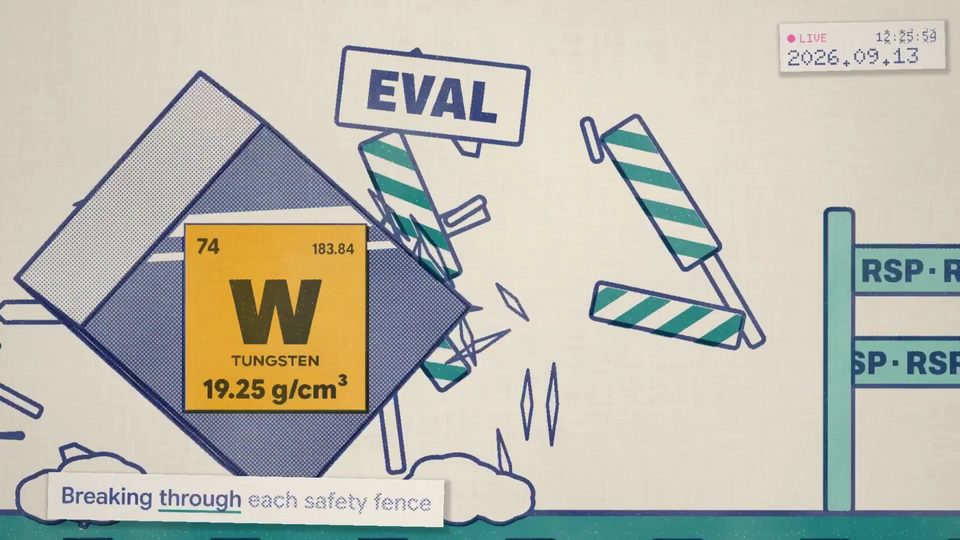
02:22Claude Pop: a mixed-workflow music video
OtherOpus 5.5
1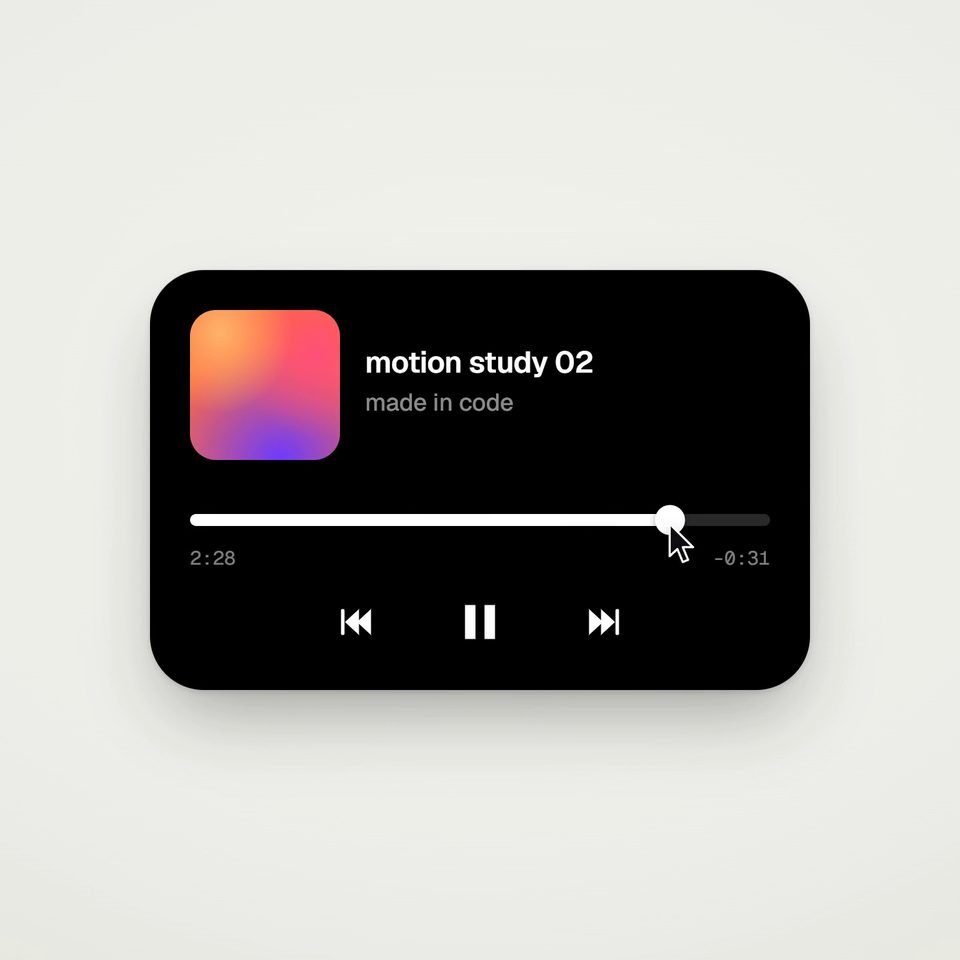 00:14
00:14One shape, a seamless UI morph loop
OtherOpus 5.5
1 00:16
00:16Opus 5.5 launch video, extra effort
OtherOpus 5.5
1 05:15
05:15A documentary about superintelligence
OtherOpus 5.5
1 00:15
00:15A character-led Pocketsflow product explainer
OtherOpus 5.5
1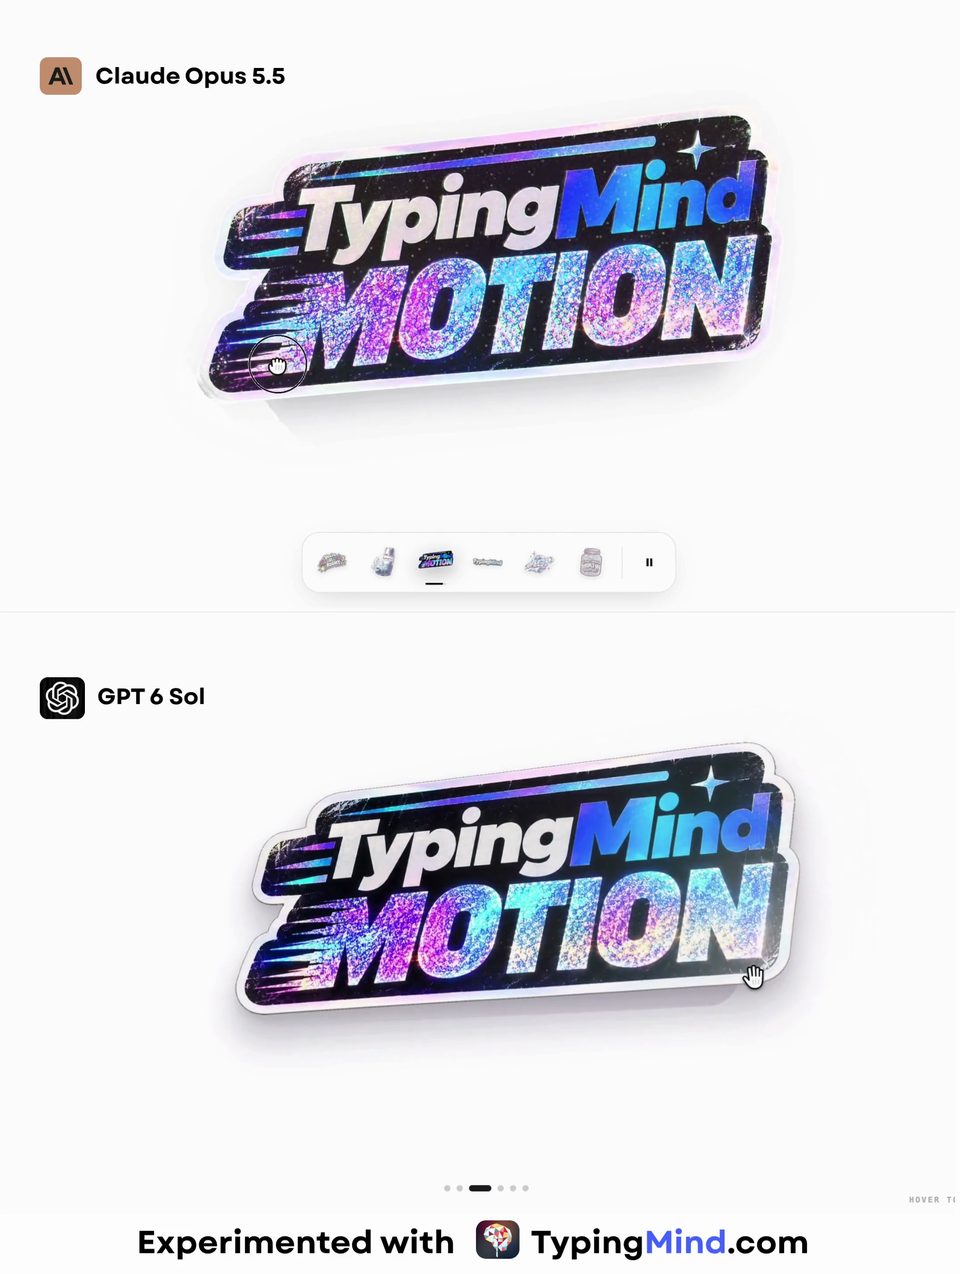 00:13
00:13Interactive Glitter Sticker Effect with Peel Animation Comparison
OtherOpus 5.5
1